
Description:
Zu Analyse- und Monitoring-Zwecken ist es sinnvoll diverse Informationen von Netzwerk-Geräten zu überwachen (z.B. CPU- und Speicher-Auslastung). Dies kann auf einer LANCOM R&S®Unified Firewall per Konsole mit dem Befehl atop vorgenommen werden. Da atop Snapshots der letzten 30 Tage anlegt, ist es zudem möglich die Auslastung der LANCOM R&S®Unified Firewall in diesem Zeitraum im Nachgang einzusehen.
In diesem Artikel wird beschrieben, wie die Monitoring-Informationen auf einer Unified Firewall mit dem Konsolen-Befehl atop eingesehen und die Snapshots mit den Monitoring-Informationen der letzten 30 Tage aufgerufen werden können.
Requirements:
- LANCOM R&S®Unified Firewall with LCOS FX as of version 10.3
- SSH client (e.g. PuTTY)
Procedure:
Reading out the current monitoring information on a Unified Firewall:
1) Connect to the Unified Firewall with an SSH client and login with the user gpadmin.

2) Enter the command atop.

3) The information is updated in a 10 second interval. The following keys can be used for navigation (common commands):
- <z> - Pauses the update until the key <z> is pressed again
- <i> <number> <Enter key> - Changes the update interval to the desired value
- <g> - Changes to the CPU specific view (default view), processes are sorted by CPU load (CPU)
- <m> - Changes to the memory specific view, processes are sorted by memory load (MEM)
- <c> - Displays the background processes (the sorting is based on the used view)
- <q> - Closes atop

Reading out a snapshot of the last 30 days:
atop creates a snapshot every 10 minutes and writes it into a logfile. A separate logfile is created for each day. It is possible to navigate between the snapshots within the logfiles, so that monitoring information of a specific time or time range can be viewed.
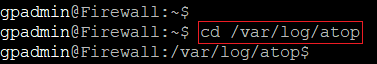
1) Enter the command cd /var/log/atop to change to the folder with the logfiles created by atop.
2) Enter the command ll to display the contents of the folder. The logfiles are named according to the scheme atop_<year><month><day> .1 (e.g. atop_20220902.1).

3) Enter the command atop -r followed by the logfile name (in this example atop -r atop_20220902.1).
The addition -r stands for read raw data from file. It is necessary because the logfiles are saved in compressed form.

4) The following keys can be used for navigation (common commands):
- <t> - Next snapshot (10 minutes forwards)
- <T> - Previous snapshot (10 minutes backwards)
- <g> - Changes to the CPU specific view (default view), processes are sorted by CPU load (CPU)
- <m> - Changes to the memory specific view, processes are sorted by memory load (MEM)
- <d> - Changes to the disk specific view, processes are sorted by the used harddisk space (DSK)
- <c> - Displays the background processes (the sorting is based on the used view)
- <q> - Closes atop
