Description:
Trace output can be used to check the internal processes in the LANCOM router during or after configuration, and as an aid to troubleshooting. A trace precisely logs the processes during connection establishment. The various parameters are recorded and can be examined for diagnostics. For example, traces can be used to display the individual stages of PPP negotiation. Experienced users who are able to understand this data can find the cause of connection failures, and they can provide useful information to LANCOM Support if necessary.
A trace can be started at the sender's end or at the receiver's end. An analysis of the resulting log files can, for example, help to find out which end is causing the problem during connection establishment.
Trace output has a slight time delay from the actual event, but the order of events is always recorded correctly. In general this does not influence the interpretation of the log file, but this should be considered when making precise analyses.
The first step when generating a trace is to create a configuration which defines the LANCOM router parameters for monitoring.
Requirements:
- LCOS as of version 8.00 (download latest version)
- LANtools as of version 8.00 (download latest version)
Procedure:
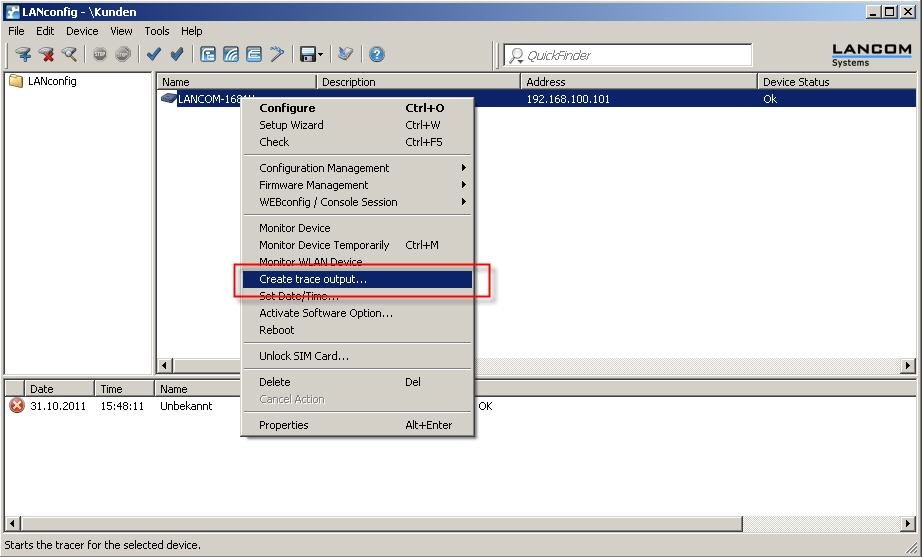
1) In LANconfig, right-click on the device entry and, from the context menu, select the option Create trace output.
2) A new window opens. As of this point, you have two options for starting a trace.
Option 1: Guided configuration (with the help of a wizard)
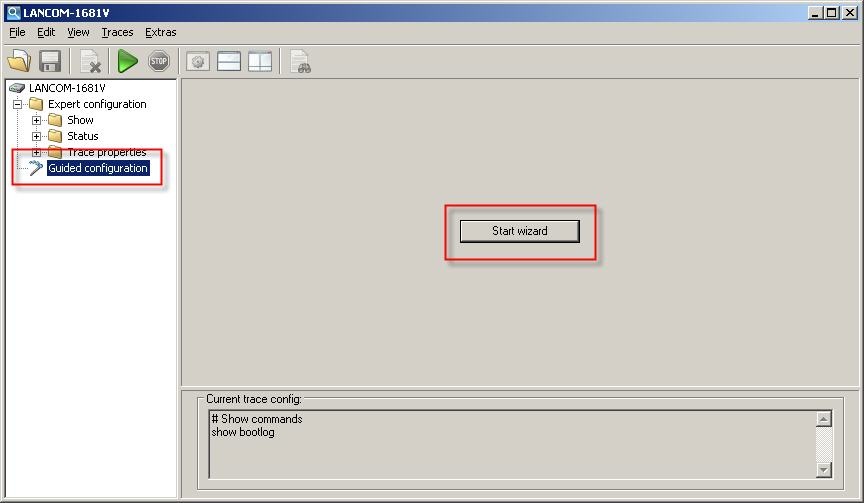
1.1) Click in the left-hand window on the item Guided configuration and then on the button Start wizard.
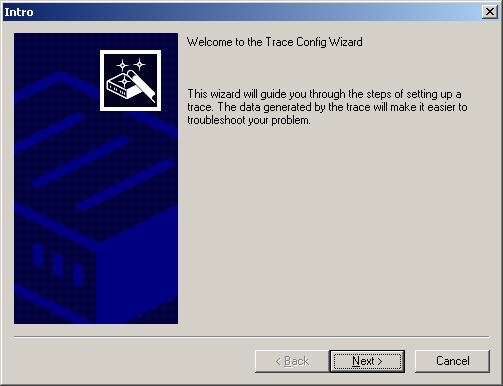
1.2) In the Trace wizard's Welcome dialog, click on the button Next.
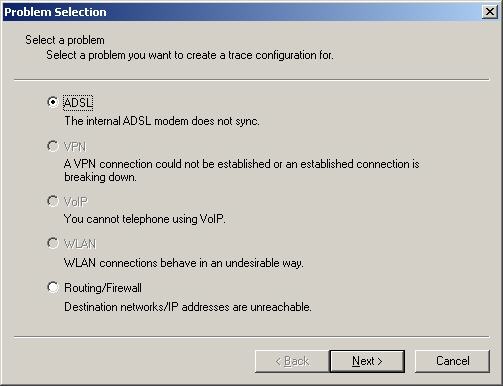
1.3) Select your problem to receive aid with troubleshooting. This allows the Trace wizard to create internal filters, which reduces the size of the log files. You have the option of limiting the log to a certain area. This example creates an ADSL trace.
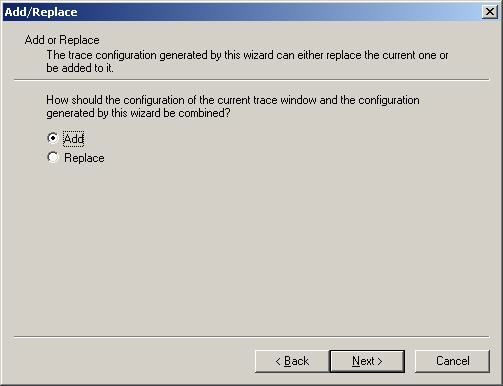
1.4) If you have already created a trace in the past (selection of parameters), you will be asked if this should be replaced. You also have the option of adding the new configuration to the old one.
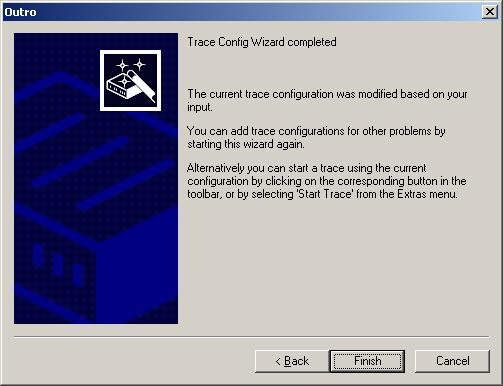
1.5) Click on the Finish button to exit the Trace wizard.
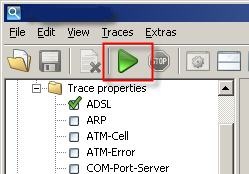
1.6) The trace will be recorded by clicking on Start trace (green button).
While the trace is recording, repeat the action(s) that caused the error.
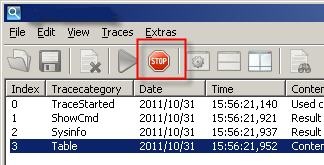
1.7) To end the trace recording, click on Stop trace (red Stop button).
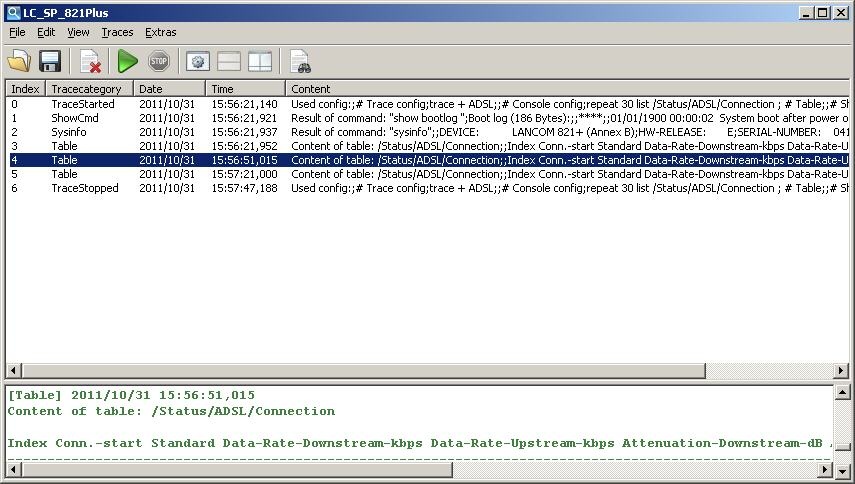
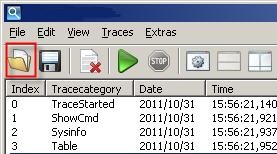
1.8) The recorded data can now by analyzed. The window is divided into two areas: In the upper area you see an index of the log entries. The trace output is displayed in the lower area.
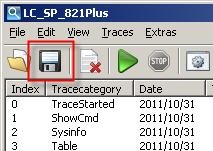
1.9) To save the trace data to a file, click on the disk icon in the menu bar.
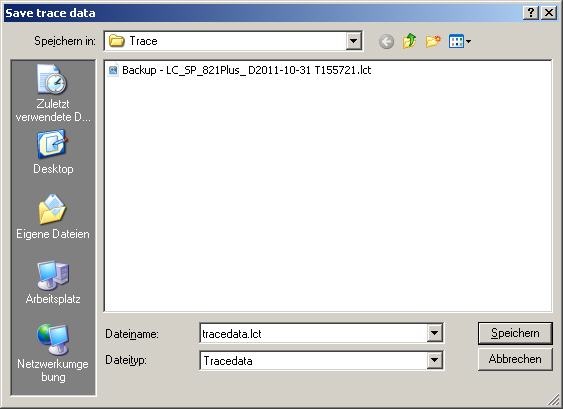
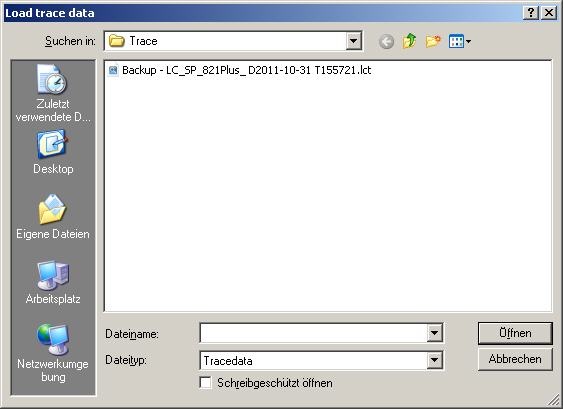
1.10) In the following dialog, specify the storage location and click on save. In doing so, the trace and the support configuration are saved.
The trace data is stored in the file with the extension *.lct, and the support configuration in the file with the extension *.spf. The LANCOM Support department requires both files for analysis.
With the key combination STRG + S only the trace configuration (file extension *.lcg) is saved, but not the trace. The trace configuration is not needed by LANCOM support.
To analyze the trace data at a later time, you can reload the overview with the folder icon in the menu bar. Alternatively you can open the *.lct file with a double-click or click on the menu File → Load trace data.
Option 2: Expert configuration (manual trace)
As an alternative to working with the wizard, you can also start a trace after selecting one or more parameters manually.
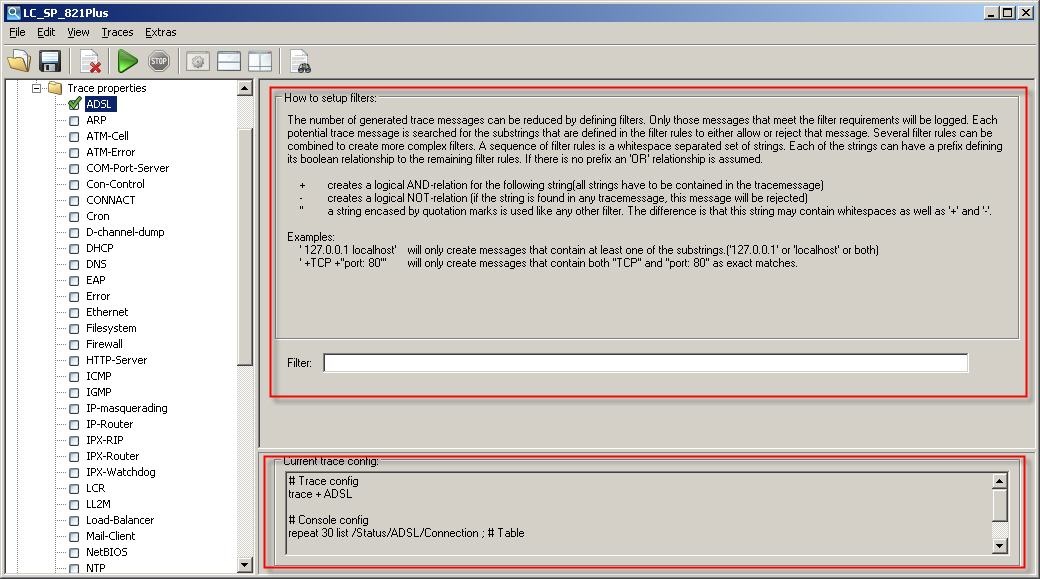
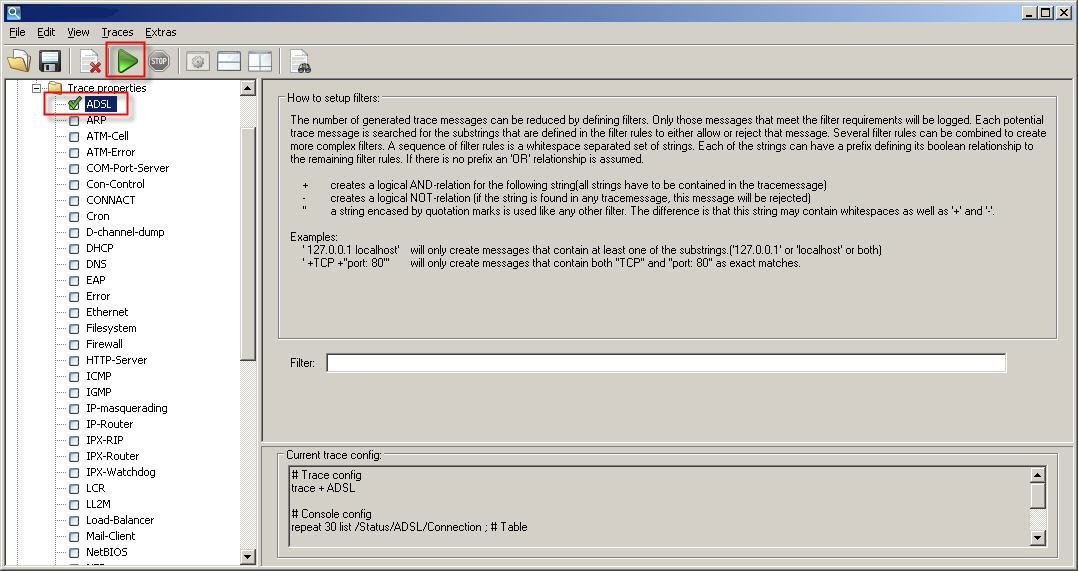
2.1) You enter this mode by clicking on Expert configuration in the left-hand window, where you then select the required trace parameter(s). In this example, we shall be logging ADSL.
2.2) The trace will be recorded by clicking on Start trace (green button).
Potential error sources / notices:
Out-of-memory - trace disable
You can use filters to optimize your troubleshooting by examining only the relevant parameters. If you log too many parameters at once, you may have run out of memory space. This is in part due to the fact that, apart from saving the log file itself, the router has to perform its usual tasks, which also take up memory space (RAM). The logging procedure will be interrupted in this case. If this occurs, you should reduce the number of parameters being logged.
After selecting the parameters, the right-hand window displays a brief overview and some information on creating filters.