
Description:
The LCOS offers the option of creating traces to analyze a wide variety of error patterns and track the processes involved. Traces can be created relatively easily using LANtracer, as prefabricated trace configurations for various error patterns are available in the Knowledge Base. If necessary, LANCOM Support can also provide suitable prefabricated trace configurations.
If LANtracer cannot be used (e.g. because Windows is not used), tracing can also be performed via the CLI.
This article describes how traces can be created on the CLI via SSH.
General information regarding trace creation via the CLI:
When entering the command trace ? this help is shown in the CLI session.
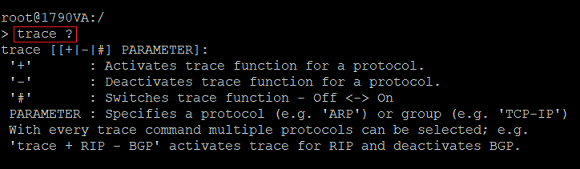
The trace command is composed as follows:
trace <Key> <Trace parameter>
The Keys are described in the following table:
| Key | Description |
|---|---|
| + | Activates the trace |
| - | Deactivates the trace |
| # | Toggle; activates the trace and deactivates it again after executing the command again |
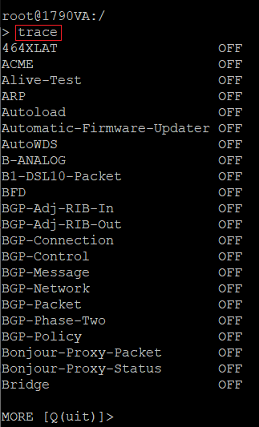
A list of supported trace parameters of your device is shown when entering the command trace.
Traces can be filtered via the @ symbol. Further restriction is possible via additional filter parameters. These are described in the following table:
| Trace filter | Description |
|---|---|
| <Space> | OR operation - The trace output is shown for each partial filter in the chain. For example, the command trace # IP-Router @ 192.168.1.10 192.168.10.20 shows output, which includes either the IP address 192.168.1.10 or 192.168.10.20. |
| + | AND operation - The trace output is only shown, when all criteria is met. For example, the command trace # IP-Router @ +192.168.1.10 +192.168.10.20 shows output, which matches both the IP-addresses 192.168.1.10 and 192.168.10.20. |
| - | NOT operation - The trace output is not shown for the excluded parameter. For example, the command trace # IP-Router @ 192.168.1.10 -192.168.10.20 only shows output which includes the IP address 192.168.1.10, but not the IP address 192.168.10.20. |
| " | The output must exactly match the entered string. For example, the command trace # IP-Router @ "port: 443" only shows output, which includes this string. The quotation marks are necessary because of the space. |
Requirements:
- Any SSH client (e.g. PuTTY)
- Access point or router with LCOS
Procedure:
The procedure in this article is described based on the SSH client PuTTY. The same steps apply to other SSH clients.
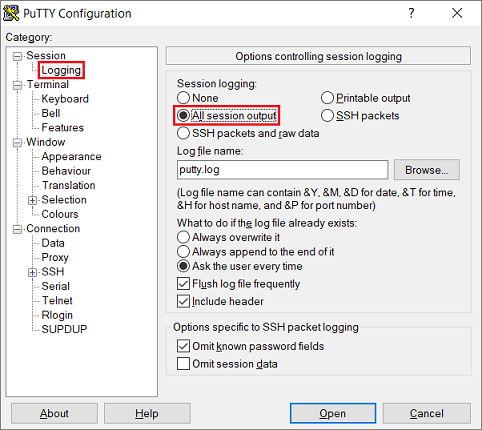
1) Logging CLI output from the SSH client in a text file (optional):
If the trace output can become extensive quickly or if the trace output should be analyzed at a later time, it is recommended to save the trace output to a text file.
Switch to the tab Logging and, under Session logging select the option All session output, so that all session output is written to the log file. You can also modify the file name under Log file name and change the file location.
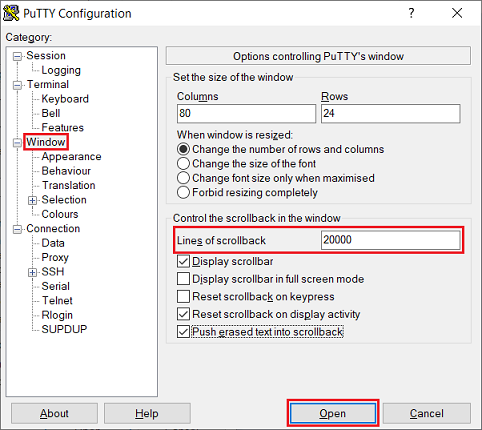
2) Raise the lines of scrollback in the SSH client (optional):
With default settings PuTTY only has 2000 lines of scrollback. When executing CLI commands with extensive output this means, that the output is cut off in the middle. For longer traces, the current output is always displayed, but the first lines are gradually overwritten. It is therefore advisable to increase the limit on the number of lines tracked.
This setting has no effect on the messages logged in a log file. If the analysis is to be performed subsequently using the log file, this setting does not need to be adjusted.
Switch to the tab Window and for the Lines of scrollback enter at least the value 20000. That's enough to ensure, that even extensive CLI output can be completely tracked.
3) Start a CLI session via SSH on a device:
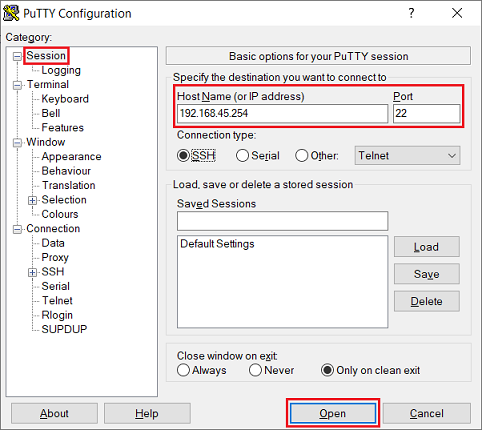
3.1) Enter the IP address or DNS name of the device in PuTTY in the tab Session in the field Host Name (or IP address) and modify the Port, if necessary. Click Open afterwards.
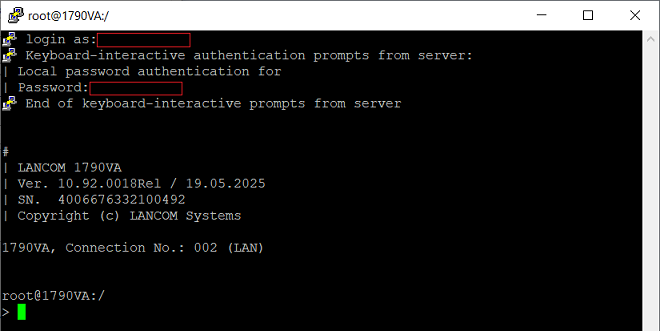
3.2) First, enter the user name (login as) and acknowledge it with <Enter>. Afterwards, enter the device password (Password) and also acknowledge it with <Enter>.
The user name and the password are not shown in a CLI session.
If you want to log in with the user root, you can leave the user field blank and press <Enter>. This will implicitly use the user root.
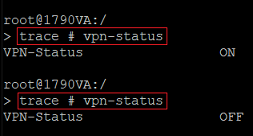
3.3) Enter the trace command of your choice, e.g. trace # vpn-status.
As the toggle command # is used in this example, this means, that the trace can also be stopped with the same command.
Creating traces analogous to prefabricated trace configurations:
When creating traces, in addition to the actual trace parameters, the associated status tables must usually also be read out.
Troubleshooting articles with prefabricated trace configurations:
- Troubleshooting guide: xDSL connection cannot be established or terminates
- Troubleshooting guide: VPN connection between two routers cannot be established or terminates
- Troubleshooting guide: Error message "Automatic media detection – could not find suitable media to establish a connection" in the Advanced VPN Client
- Troubleshooting guide: A device attempting to authenticate in the Wi-Fi is rejected or the device loses the Wi-Fi connection (LCOS)
- Troubleshooting guide: An access point cannot obtain a WLAN profile from the WLAN-Controller
- Troubleshooting Guide: The Content Filter does not function correctly
- Troubleshooting guide: (Remote) troubleshooting of UMTS/3G and LTE/4G connections
- Troubleshooting guide: Port forwarding not working
- Troubleshooting guide: Error analysis in VoIP scenarios
- Troubleshooting guide: Firmware update of a LANCOM device via the LANCOM Management Cloud fails
Display date and time as well as the CLI path automatically:
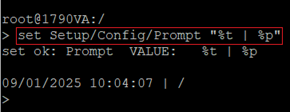
Especially for status tables it is important, that the time, when the table was read out, is also displayed. This can be implemented by setting the variable %t (date and time) for the Prompt of the device. Additionally, the variable %p (CLI path) has to be set, as otherwise only date and time would be displayed, which would make navigation much harder.
Enter the following CLI command:
set Setup/Config/Prompt "%t | %p"
After modifying the Prompt, the support configuration file (*.spf) can only be written by the LANtracer in rare cases. Therefore, this modification only should be implemented, when the LANtracer is not used!
Example based on the trace configuration "WLAN-Connection":

It is recommended to begin with reading out the status tables and querying the trace parameters afterwards. The bootlog is not needed in this example. If necessary, it can be read out separately.
Reading out the status tables:
- If the status tables should be read out periodically, they must be combined in a command chain. Otherwise, entering individual commands would interrupt the periodic readout of previously queried status tables (by pressing <Enter>).
- To readout tables periodically, the command repeat <x> must be used, where x is the time in seconds between the intervals. This command must be entered at the start of the command chain.
- The command ls must be set at the beginning of each table path.
- The partial commands to read out a status table must each be separated via <Space>;<Space>.
This results in the following command chain:
repeat 30 ls /Status/WLAN/Interfaces ; ls /Status/WLAN/Log-Table ; ls /Status/WLAN/Competing-Networks ; ls /Status/WLAN/WLAN-Parameter ; ls /Status/WLAN/Seen-Clients ; ls /Status/WLAN/Radios ; ls /Status/WLAN/Byte-Transport ; ls /Status/WLAN/Errors ; ls /Status/WLAN/Station-Table
Reading out the trace parameters:
- It is recommended to use the # key (toggle). In doing so, traces can also be stopped by executing the same command again.
- Trace commands can be strung together by separating them via the <Space> key. This is an OR operation, meaning that trace messages are output for each specified trace parameter.
This results in the following command chain:
trace # Error EAP Status WLAN-STATUS
A copied command chain can be entered in PuTTY via a rightclick. After acknowledging it via <Enter> the command is executed.